
This is the first in a series of posts where we highlight some of our recent features.
The team are busy working on some great features, due to roll out to our customers over the coming months, however we wanted to share with you one feature that appeared shortly after launch, which you may not have seen.
We’ve been getting fantastic feedback about the timeliness and agile nature of the weekly staff sentiment reports, however we know that many are keen to view a longer term true of staff engagement.
That’s where our ‘My Trends’ feature comes in.
As an example, here is a six week view of staff assessment of their own levels of productivity. This shows that whilst the 19 March view had a team average of around 80%, something occurred around the 2nd April, which caused this to dip down to around 67%. You can then see productivity rose again back to the initial score in the week of 16 April.
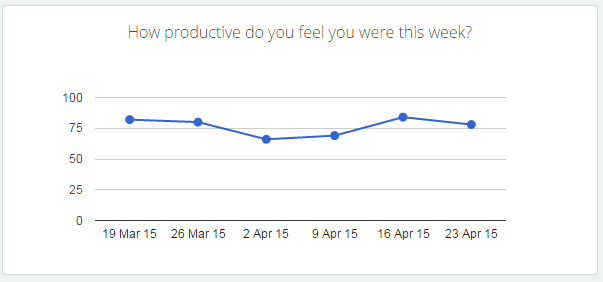
Interestingly, this could be the result of a number of factors. For example, if there had been changes within the team, a down time in workload, or perhaps a number of team members had illnesses or some other factor.
I think it’s very important to have a feedback loop, where you’re constantly thinking about what you’ve done and how you could be doing it better.
– Elon Musk
Imagine tracking other questions in times of great upheaval, profit announcements, management changes or other larger organisational changes; using this data, we can plot staff sentiment and staff engagement, based on both internal and external stimuli.
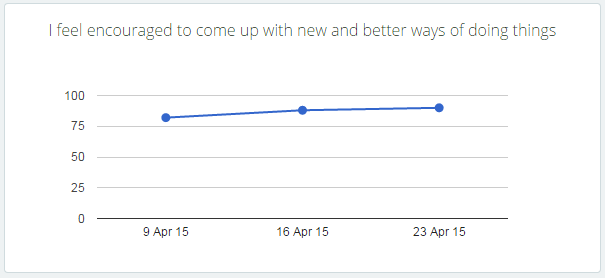
The below graph is another example, this time showing a three week period of staff responses for an innovation question. You can see that there is a slight rise over this timeline.
It would be interesting to see if this is reflective of some change in scope for the team, or if employees were asked to address innovation or similar. The ability to see small effects amongst employees, based on larger organisation changes is one of the exciting components of 6Q for us.
Good news is that this feature is available for all customers right now. You can find these staff response graphs in the My Trends tab within your dashboard. All questions asked over the last six weeks will be displayed, along with the average score of all employees being polled.
We hope this explains the My Trends feature for you, and we wish you all the best in analysing your staff engagement data.